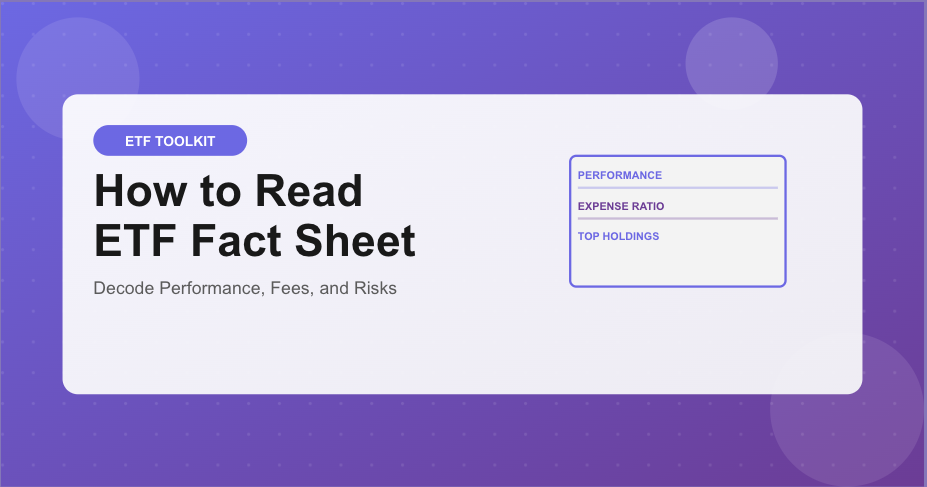
How to Read ETF Fact Sheet: Complete Guide to Performance, Fees & Risk Analysis
Ever stared at an ETF fact sheet and felt completely lost? You’re not alone. These dense documents contain the exact information you need to make smart investment decisions—but only if you know how to read an ETF fact sheet correctly. This guide decodes every critical section so you can confidently evaluate any ETF in minutes.
Why Learning to Read ETF Fact Sheet Documents Matters
An ETF fact sheet is the single most important document for evaluating exchange-traded funds. Think of it as the ETF’s resume—it reveals performance history, fees, holdings, and risks in a standardized format. Learning how to read an ETF fact sheet properly transforms you from a passive investor who relies on tips into an informed decision-maker who understands exactly what you’re buying.
Most investors skip reading the ETF fact sheet entirely, relying instead on headlines or past performance rankings. This is dangerous. The ETF fact sheet contains warning signs that can save you from costly mistakes: excessive fees, concentrated holdings, high turnover, or mismatched investment objectives. Master how to read an ETF fact sheet, and you’ll immediately spot red flags other investors miss.
Where to Find an ETF Fact Sheet
Before you can read an ETF fact sheet, you need to locate it. Every ETF provider publishes fact sheets on their website, typically under “Literature” or “Documents” sections. You can also find ETF fact sheet documents directly through:
- ETF Provider Websites: Vanguard, BlackRock (iShares), State Street (SPDR), Schwab, Invesco
- Financial Data Sites: ETF.com, Morningstar, Yahoo Finance all link to official fact sheets
- Brokerage Platforms: Fidelity, Schwab, TD Ameritrade display fact sheets in research sections
- EDGAR Database: SEC filings include N-CEN and annual reports with detailed data
💡 Pro Tip: Always download the ETF fact sheet directly from the fund provider’s official website. Third-party summaries may be outdated or incomplete. When you read an ETF fact sheet from the source, you get the most current data available.
ETF Fact Sheet Anatomy: The Essential Sections
Every ETF fact sheet follows a similar structure. Understanding each section helps you read an ETF fact sheet efficiently and extract critical information quickly.
1. Fund Overview and Objective
The top of every ETF fact sheet states what the fund does. This section answers: What index does it track? What market segment does it target? What investment strategy does it follow?
What to look for when you read an ETF fact sheet overview:
- Investment Objective: Does it match your goals? Growth vs. income vs. preservation?
- Benchmark Index: What index does this ETF replicate? S&P 500? MSCI World?
- Strategy Description: Passive index tracking or active management? Full replication or sampling?
- Inception Date: How long has the ETF existed? Newer funds lack long-term track records
📊 Real ETF Fact Sheet Example: SPY (SPDR S&P 500 ETF Trust)
Fund Objective: “Seeks to provide investment results that correspond generally to the price and yield performance of the S&P 500 Index.”
When you read this ETF fact sheet objective, you learn:
* It’s a passive index fund (not actively managed)
* It tracks the S&P 500 (large-cap U.S. stocks)
* Performance should mirror the index closely
* Expect broad market returns, not outperformance
This simple objective tells you immediately whether SPY fits your portfolio strategy. If you want dividend income or international exposure, this ETF fact sheet reveals SPY isn’t the right choice.
2. Performance Data: The Numbers That Matter
The performance section dominates most ETF fact sheet documents. When you read an ETF fact sheet performance section, focus on these critical metrics:
Total Returns (Multiple Timeframes):
Every ETF fact sheet displays returns for 1-month, 3-month, year-to-date, 1-year, 3-year, 5-year, and since-inception periods. When you read an ETF fact sheet return data, look for consistency across timeframes, not just recent performance.
Benchmark Comparison:
The ETF fact sheet should compare fund returns against its stated benchmark. This reveals tracking effectiveness. If the ETF fact sheet shows consistent underperformance versus the benchmark, that’s a red flag indicating high fees or poor execution.
NAV vs Market Price Returns:
When you read an ETF fact sheet, you’ll see two return figures: NAV (Net Asset Value) returns and Market Price returns. NAV represents the actual value of underlying holdings. Market Price reflects what investors pay on exchanges. Large discrepancies suggest liquidity problems or inefficient arbitrage.
| Return Period | What It Tells You | Red Flag |
|---|---|---|
| 1-Month / 3-Month | Recent momentum and volatility | Ignore for long-term decisions |
| 1-Year | Annual performance snapshot | Can be misleading in isolation |
| 3-Year / 5-Year | Medium-term consistency | Most reliable metric for evaluation |
| Since Inception | Full track record | New ETFs lack this data |
3. Expense Ratio: The Cost That Never Stops
When you read an ETF fact sheet, the expense ratio is arguably the most critical number. This annual fee percentage directly reduces your returns every single year you hold the ETF.
How to read ETF fact sheet expense ratios:
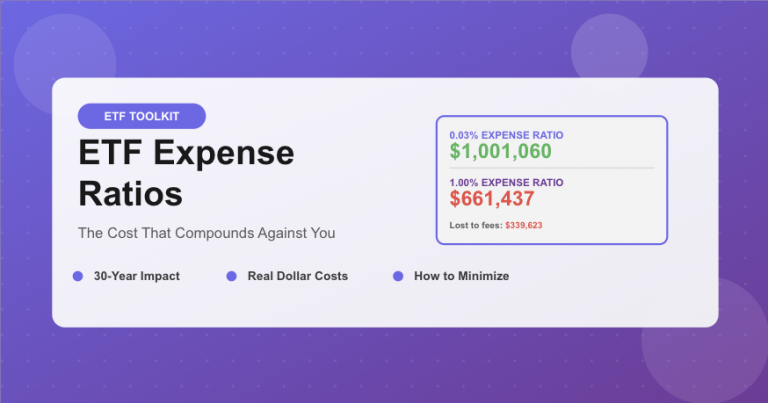
The ETF fact sheet lists the expense ratio as a percentage (e.g., 0.03%, 0.50%, 1.00%). This represents the annual cost as a percentage of your investment. A 0.50% expense ratio means you pay $50 per year for every $10,000 invested.
⚠️ Critical: When you read an ETF fact sheet expense ratio, understand it compounds over time. A 1% expense ratio doesn’t just cost 1% this year—it costs approximately 25% of your returns over 30 years due to lost compound growth. Always favor lower-cost ETFs when objectives are identical.
Expense ratio benchmarks when you read ETF fact sheet documents:
- 0.03% – 0.10%: Excellent (large passive index ETFs like VOO, VTI)
- 0.10% – 0.30%: Good (most broad market ETFs)
- 0.30% – 0.50%: Acceptable (specialized or international ETFs)
- 0.50% – 0.75%: High (better have strong justification)
- Above 0.75%: Expensive (approach with extreme caution)
4. Holdings: What You Actually Own
The holdings section of an ETF fact sheet reveals exactly what assets the fund owns. When you read an ETF fact sheet holdings section, examine:
Top 10 Holdings:
Most ETF fact sheet documents list the largest positions. If the top 10 holdings represent 50%+ of the fund, you have significant concentration risk. When you read an ETF fact sheet showing heavy concentration, understand that a few companies drive most of your returns and risks.
Sector Allocation:
The ETF fact sheet breaks down investments by sector (Technology, Healthcare, Finance, etc.). This reveals hidden concentrations. An S&P 500 ETF might seem diversified until you read the ETF fact sheet and discover 30% sits in technology stocks.
Number of Holdings:
When you read an ETF fact sheet, note the total number of holdings. More isn’t always better, but extremely concentrated ETFs (under 30 holdings) carry higher risk than broadly diversified funds (500+ holdings).
5. Risk Metrics and Statistics
Every ETF fact sheet includes risk metrics. When you read an ETF fact sheet risk section, these numbers quantify volatility and downside potential:
Standard Deviation:
Measures volatility. Higher standard deviation means larger price swings. When you read an ETF fact sheet showing 20%+ standard deviation, expect significant year-to-year volatility.
Beta:
Compares volatility to the broader market. A beta of 1.0 moves with the market. Beta above 1.0 amplifies market moves. When you read an ETF fact sheet with 1.5 beta, expect 50% more volatility than the overall market.
Sharpe Ratio:
Risk-adjusted returns. Higher is better. When you read an ETF fact sheet, a Sharpe ratio above 1.0 indicates good risk-adjusted performance.
How to Read ETF Fact Sheet Documents: Step-by-Step Process
Now that you understand each section, here’s your systematic process to read an ETF fact sheet effectively:
Step 1: Start with Objective (30 seconds)
Read the ETF fact sheet objective. Does this fund do what you need?
Step 2: Check Expense Ratio (15 seconds)
When you read the ETF fact sheet expense ratio, is it competitive? If not, find alternatives.
Step 3: Review 3-Year and 5-Year Performance (1 minute)
Ignore recent returns. When you read the ETF fact sheet medium-term data, how consistent is performance?
Step 4: Examine Top Holdings (1 minute)
Read the ETF fact sheet holdings section. Any concentration concerns? Sector imbalances?
Step 5: Assess Risk Metrics (1 minute)
When you read the ETF fact sheet risk data, does the volatility match your tolerance?
Step 6: Compare Against Alternatives (2 minutes)
Read multiple ETF fact sheet documents for similar funds. Which offers the best value?
Total Time: Under 6 minutes per ETF
Common ETF Fact Sheet Red Flags
As you learn to read an ETF fact sheet, watch for these warning signs:
🚩 Consistent Underperformance vs Benchmark
When you read an ETF fact sheet showing the fund consistently trails its stated benchmark by 0.50%+ annually, something is wrong. Possible causes: high fees, poor replication strategy, or excessive trading costs.
🚩 Large NAV vs Market Price Discrepancies
If the ETF fact sheet shows frequent gaps between NAV returns and market price returns exceeding 0.20%, the ETF suffers from liquidity or arbitrage issues. This costs you money through slippage.
🚩 Extremely High Turnover
When you read an ETF fact sheet showing turnover above 100% annually, the fund is essentially replacing its entire portfolio each year. This generates excessive trading costs and potential tax inefficiency.
🚩 Misleading Fund Names
Don’t judge by name alone. Always read the ETF fact sheet holdings. A fund called “Global Technology” might be 70% U.S. stocks. Names lie; fact sheets reveal truth.
Practice Makes Perfect: Read ETF Fact Sheet Examples
The best way to master how to read an ETF fact sheet is practice. Download fact sheets for these popular ETFs and apply the 6-step process:
- VOO (Vanguard S&P 500 ETF): Excellent baseline for how a quality ETF fact sheet looks
- AGG (iShares Core U.S. Aggregate Bond ETF): Learn to read a bond ETF fact sheet
- VWO (Vanguard FTSE Emerging Markets ETF): Practice reading international ETF fact sheet data
- QQQ (Invesco QQQ Trust): See how to read an ETF fact sheet for growth-focused funds
Read each ETF fact sheet, then compare them side-by-side. You’ll quickly develop an eye for quality funds versus mediocre ones.
🎯 Master ETF Analysis
Now you know how to read an ETF fact sheet like a professional analyst.
Practice with 3-5 fact sheets this week. You’ll be amazed how quickly you spot quality funds versus expensive underperformers.
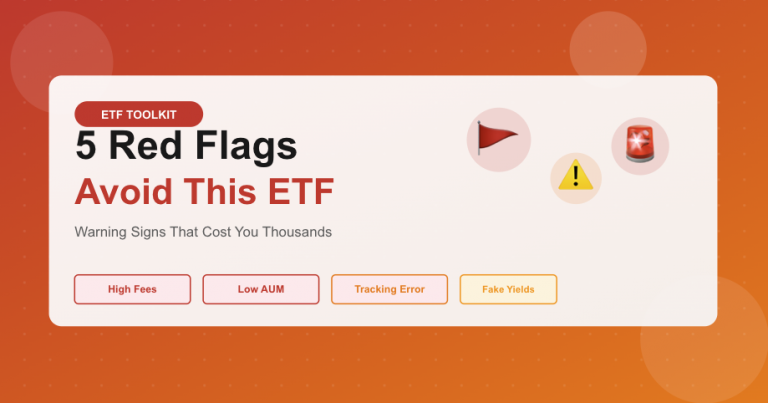
📈 Next in ETF Toolkit Series: Now that you can read an ETF fact sheet, we’ll tackle “5 Red Flags That Scream ‘Avoid This ETF'”—the warning signs hiding in those fact sheets that cost investors thousands. Subscribe to never miss an update!